Through the Patient Protection and Affordable Care Act (PPACA), non-profit hospitals are required to complete a Community Health Needs Assessment and implementation plan to inform their community benefit and community building activities every three years. This assessment is an important opportunity to hear directly from community residents and community organizations. In Southeastern Pennsylvania, the following health systems participated in the 2025 rCHNA: Children’s Hospital of Philadelphia, ChristianaCare – West Grove, Doylestown Health, Grand View Health, Jefferson Health, Main Line Health, Penn Medicine, St. Christopher’s Hospital for Children, Temple University Health, Trinity Health Mid-Atlantic, Wills Eye Hospital.
The rCHNA assesses population health and social needs indicators for geographic communities, and engages community voices in one streamlined process to gain their perspective on community assets, needs, and proposed solutions.
To view the complete report in PDF format, see the 2025 rCHNA Report Components. You can also use the geographic filters below to explore quantitative data for Bucks, Chester, Delaware, Montgomery and Philadelphia counties.

Explore data by county
Bucks
There are 8 acute care/specialty hospitals and one health center in Bucks County.
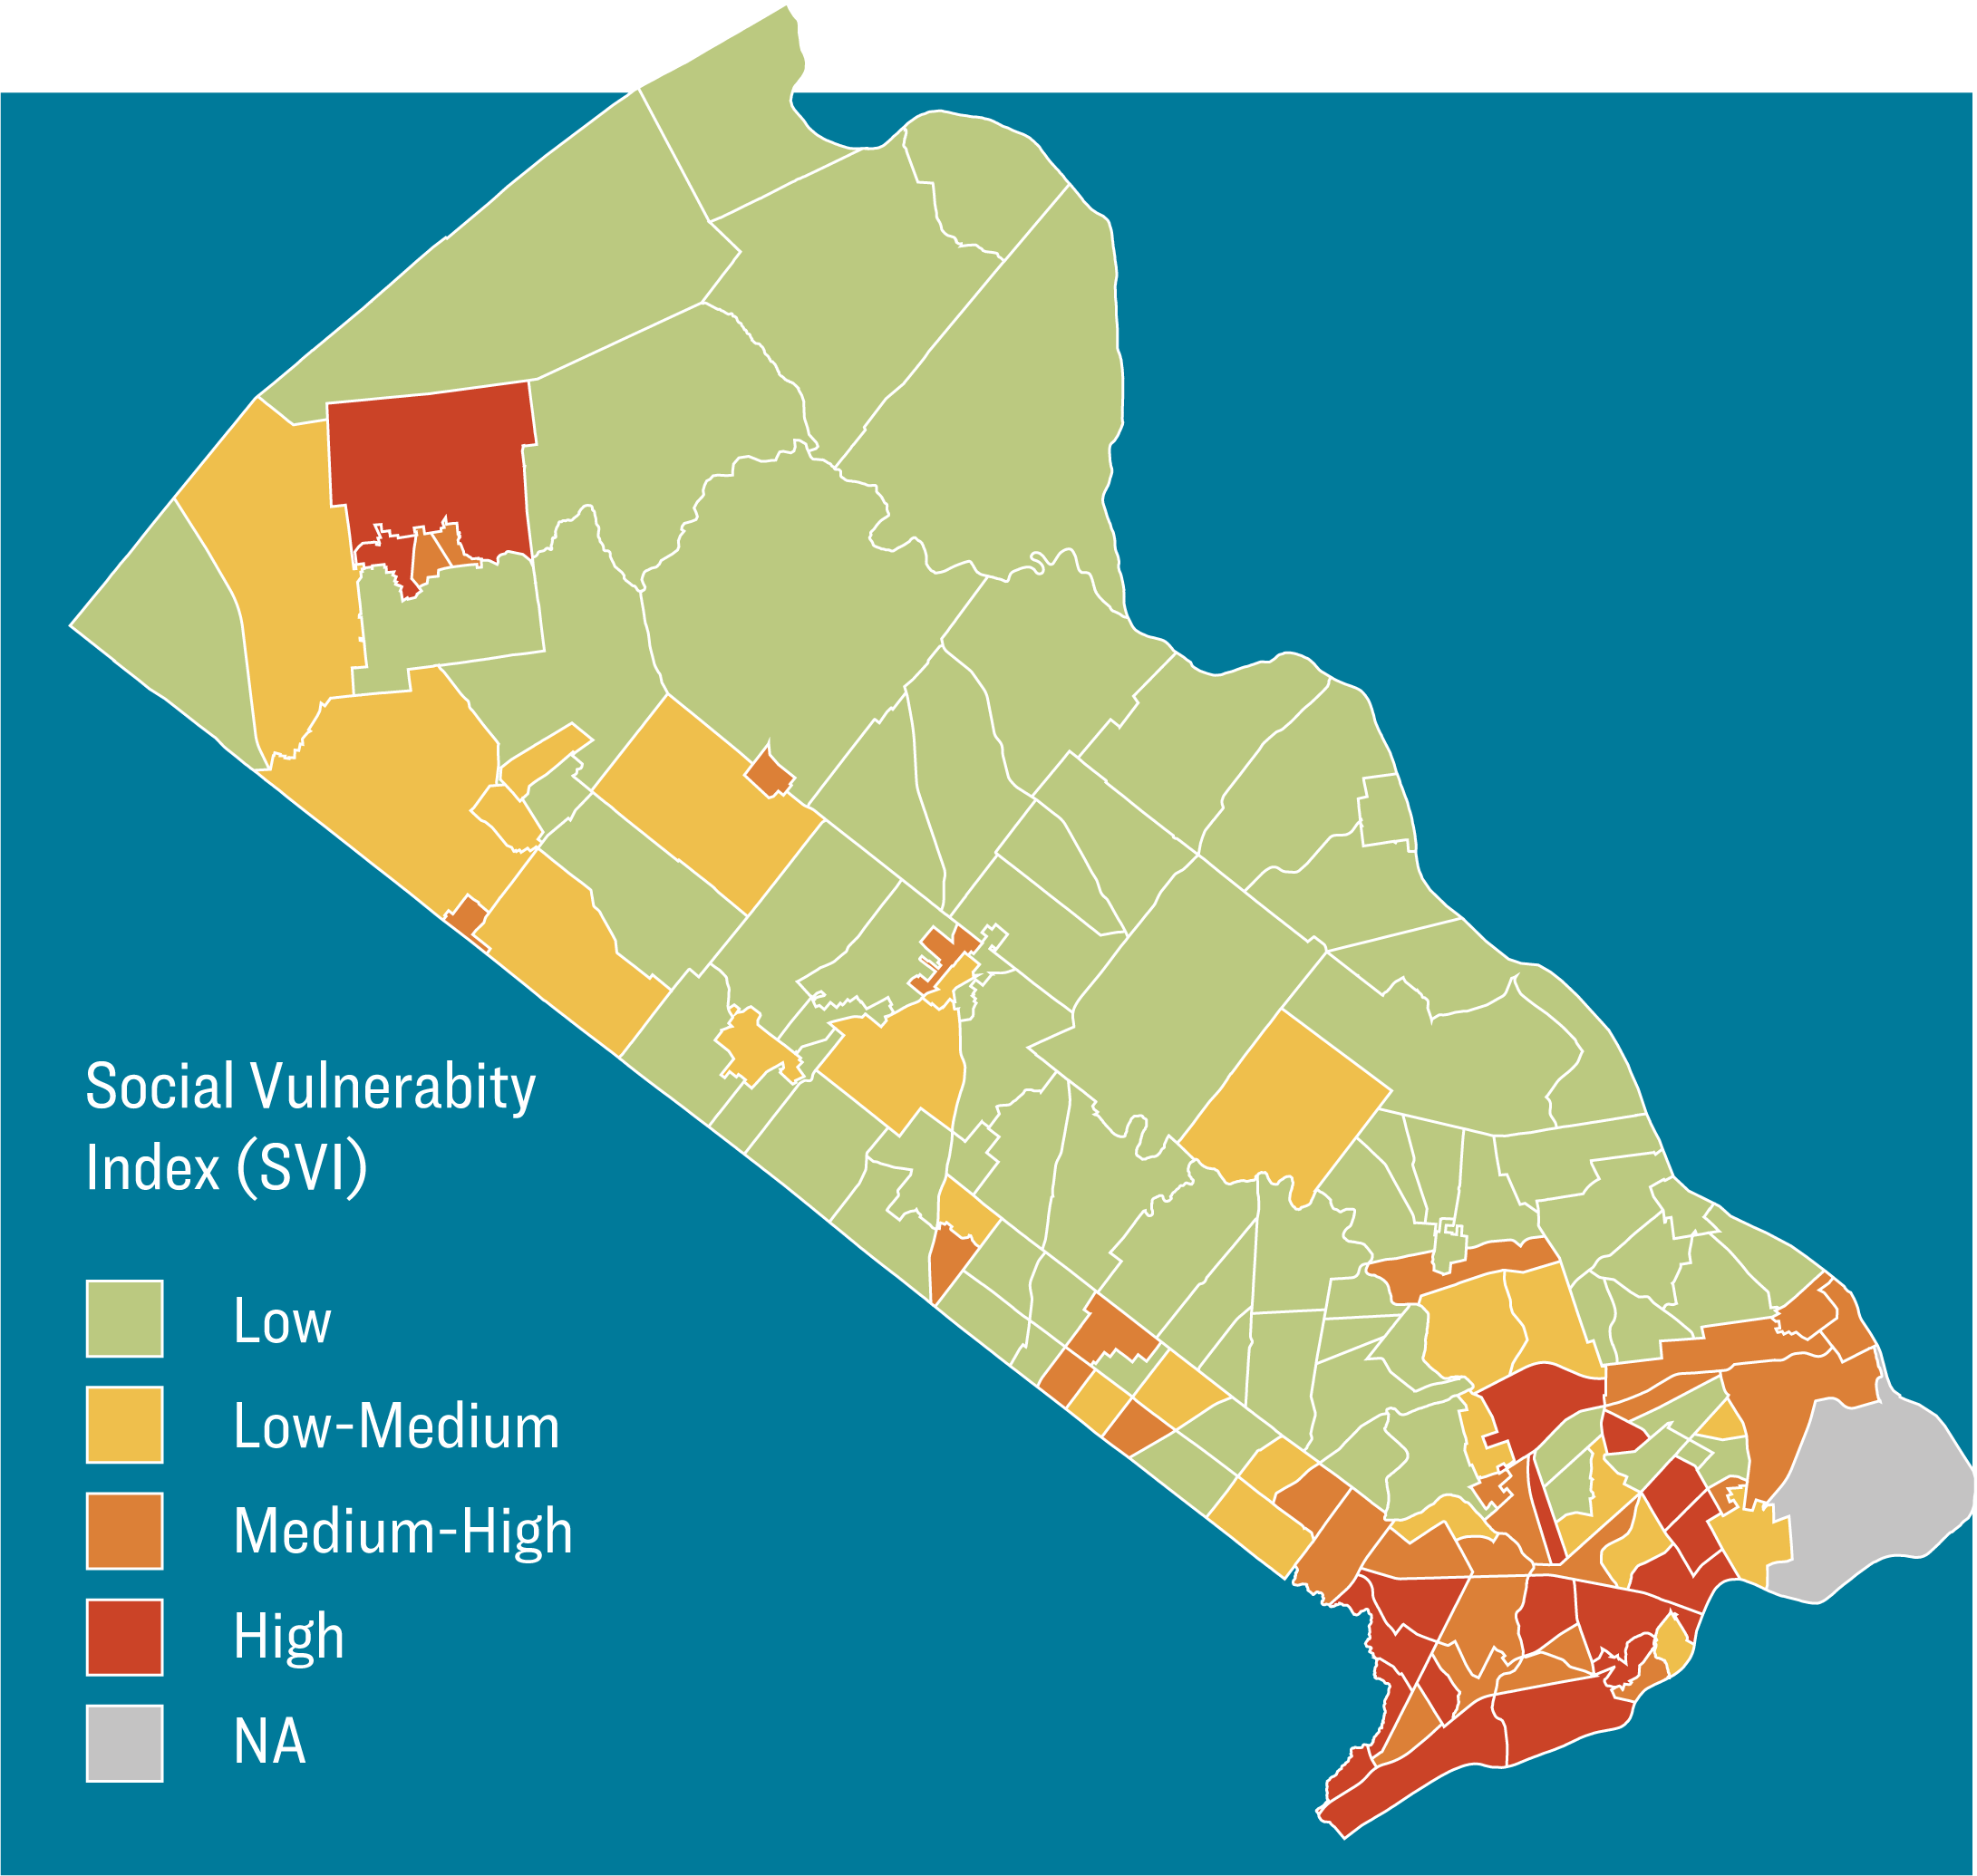
Social Vulnerability Index (SVI)
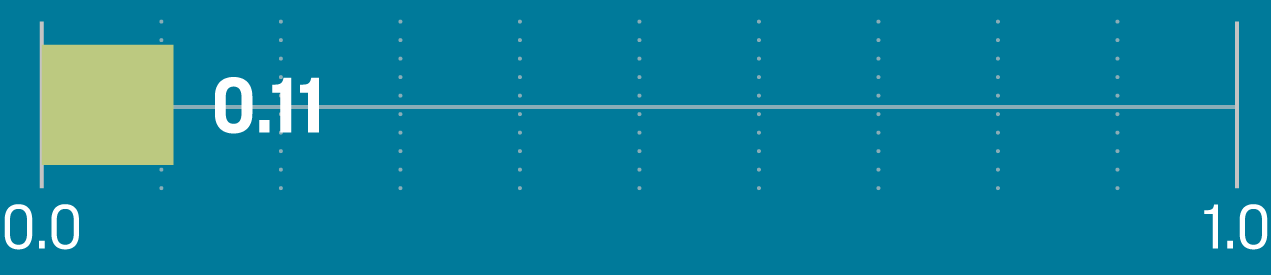
An SVI score ranges from 0 to 1, with a higher score suggesting greater vulnerability to disasters and emergencies.
Demographics
Age Distribution
Bucks County has an estimated population of 645,993 with the largest proportion of residents between the ages of 45 - 64.

Sex

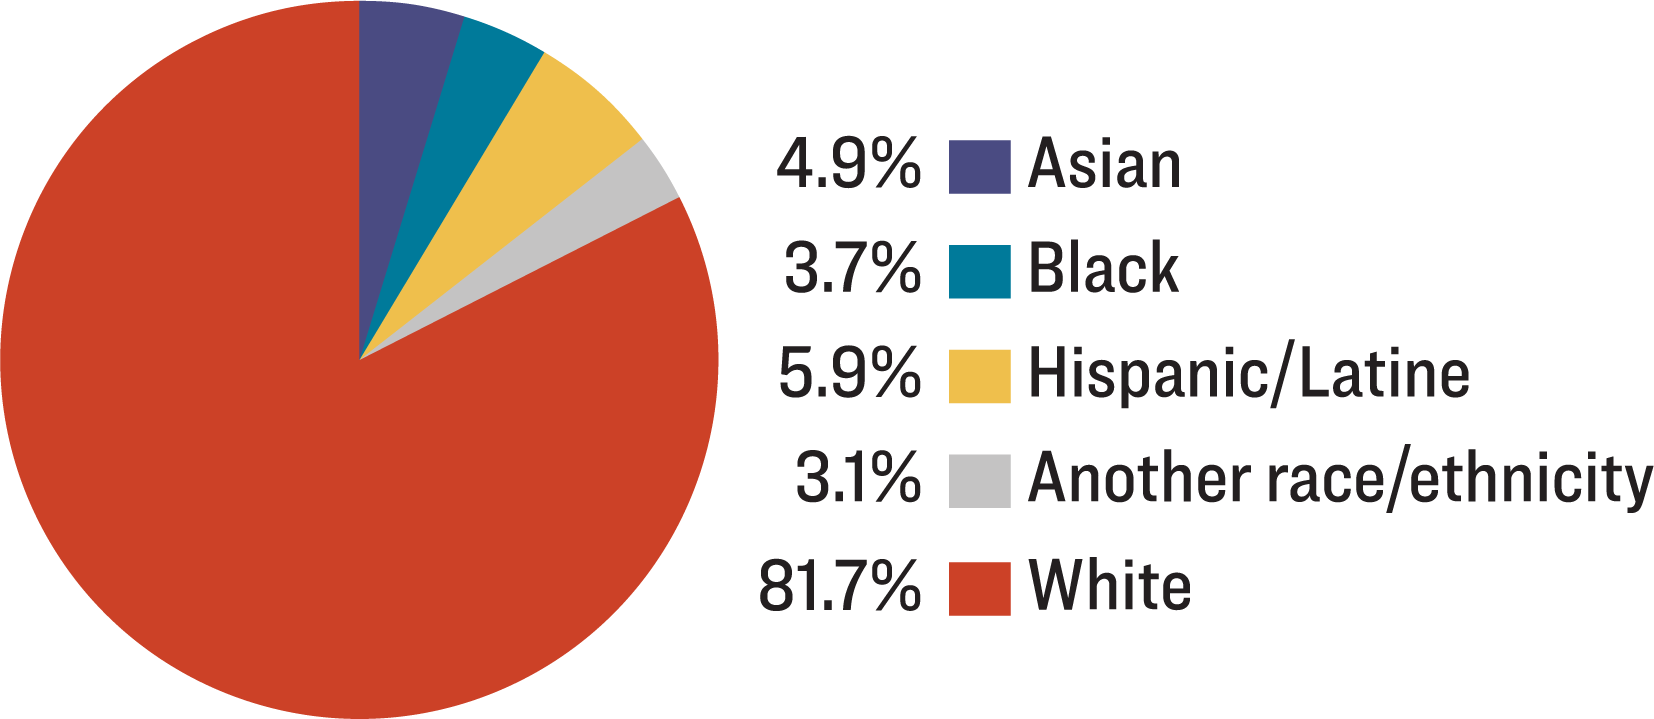
Race/Ethnicity
82% of residents are non-Hispanic White. Hispanic/Latine residents make the next largest population, comprising nearly 5.9% of the county’s residents.
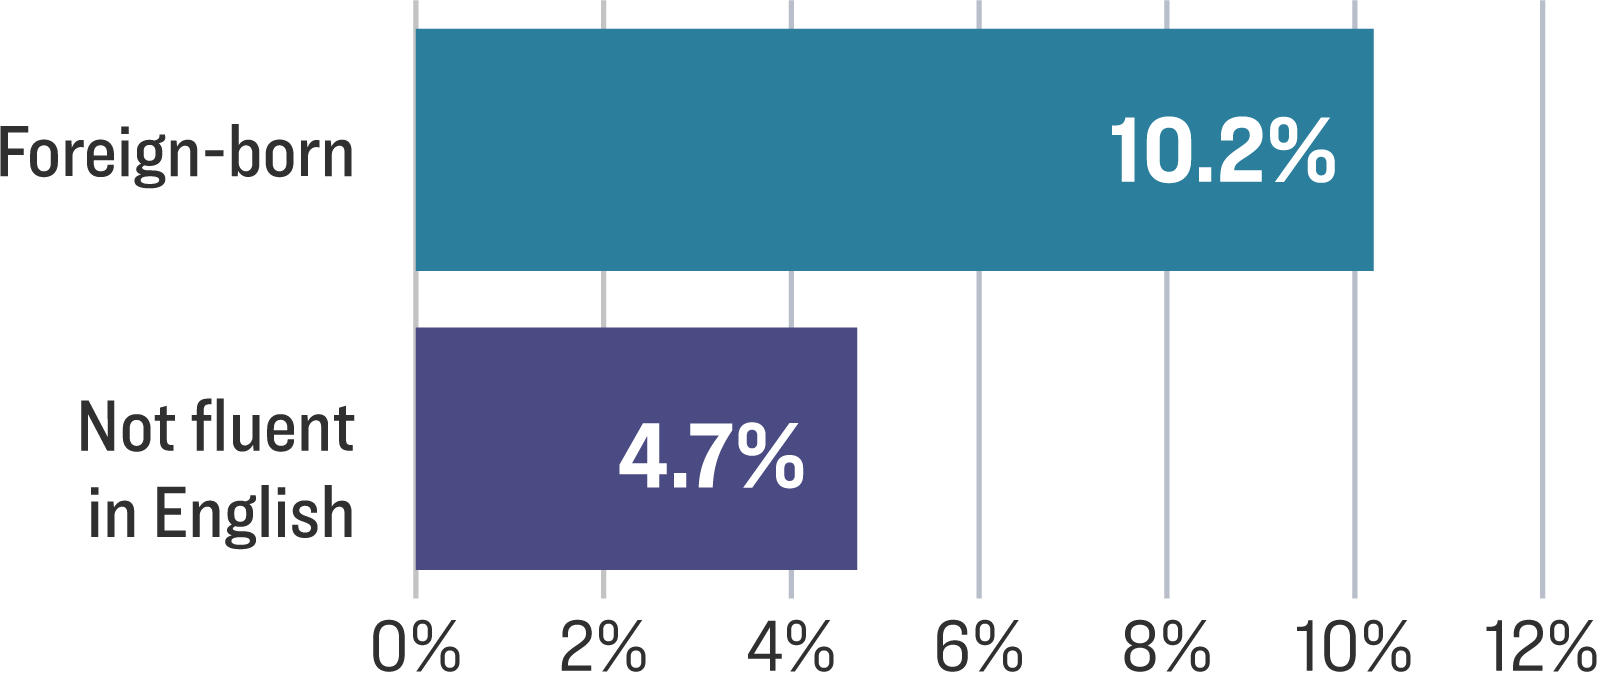
Language
Approximately 10% of residents are foreign-born and about 5% speak English less than “very well.”
Median household income
Homeownership
Severe housing cost burden
% spending > 50% of household income
High school as highest education
Household food insecurity
Single parent households
Same sex couples
per 1,000 households
Commute greater than 60 minutes
Health
Leading Causes of Death
- Cancer
- Heart Disease
- COVID-19
- Cerebrovascular Diseases
- Chronic Lower Respiratory Diseases
Children & Youth Behavior
Ever Attempted Suicide
Depressed/Sad most days in the past 12 months
Binge drinking
Cigarette smoking
Vaping
People with Disabilities
Percent of Population
Poverty Status (last 12 months)
Have difficulty with hearing
Have difficulty with vision
Have difficulty with cognition
Have difficulty with ambulatory
Have difficulty with self-care
Have difficulty with independent living
Violence & Safety
Mortality from gun violence
Violent Crime Rateper 100,000
Gun-related ED Use
Community Health Status
High ED Utilization
Flu vaccinations (adult)
Chylamydiaper 100,000
Income inequality
County Survey Results
Mental health
Heart conditions
Diabetes and high blood sugar
Depression
Anxiety
Alcohol use
Mental health
Intellectual / developmental disabilities
Obesity and maintaining healthy weight
Bullying
Anxiety
Depression
Costs associated with getting healthcare
45.9%
Transportation (getting to and from doctor's visits/appointments)
33.1%
No health insurance
27.6%
Health insurance is not accepted
27.3%
Scheduling problems (such as health services not open when available)
20.2%
Fear (i.e. fear of doctors or not ready to discuss a health problem)
18.4%
Not enough healthcare services or providers
17.5%
Language barriers
13.0%
Don't feel welcome or respected
10.5%
Don't know how to find healthcare services or providers
7.5%
None
6.6%
Mistrust of the health systems
5.4%
Not sure
4.5%
Cultural / religious beliefs
3.5%
2025 rCHNA Report Components
Download PDFs of the 2025 Regional Community Health Needs Assessment
2025 rCHNA: Background
Introduction, Health System Profiles, Partner Organization Profiles, Methods, Service Area Map (129 pages, 59 MB)
2025 rCHNA: Delaware County
Qualitative and Quantitative Data for Delaware County (36 pages, 2.5 MB)
2025 rCHNA: Montgomery County
Qualitative and Quantitative Data for Montgomery County (59 pages, 5.3 MB)
2025 rCHNA: Philadelphia County
Qualitative and Quantitative Data for Philadelphia County (76 pages, 3.8 MB)
2025 rCHNA Appendix & Resources
2025 rCHNA — Appendix: Community Conversation Summaries
Summaries of focus group-style community conversations by individual geographic communities. (Zip archive, 1 MB)
2025 rCHNA — Appendix: Community Resource Listing
Information about community resources in all five counties. (Excel file, 116K)
2025 rCHNA — Appendix: Data Collection Tools
Instruments used to collect primary qualitative data. (Zip archive, 9.8 MB)